
Intercarto: managing 50 urban planning projects with GanttPRO
“Your Gantt chart is incredibly visual. And the resource workload tool is simply outstanding.”
How do you keep dozens of long-term projects under control when overloading just one specialist can slow work down for months? Interkarto built a transparent planning system with GanttPRO to spot risks in advance and manage resources more effectively.

Company overview
Company: Interkarto
Roles interviewed: Grigori Shuturminski, CEO
Project types: urban planning projects with multiple stages and dependencies
External pressures: risks of overloading key specialists, tight deadlines, complex coordination
Tool history: Clickup, monday.com
Problems hinted at: lack of visibility into team capacity and dependencies
Company Background
What does your company focus on?
Interkarto is a team of engineers and architects working in urban design. Projects in this field typically run for more than six months and follow a multi-stage structure, where each next phase can begin only after the previous one is completed. At the same time, the team manages more than 50 projects of different scales. As a result, they needed clear resource visualization, control over the sequence of stages, and the ability to assess specialists’ workload in advance.
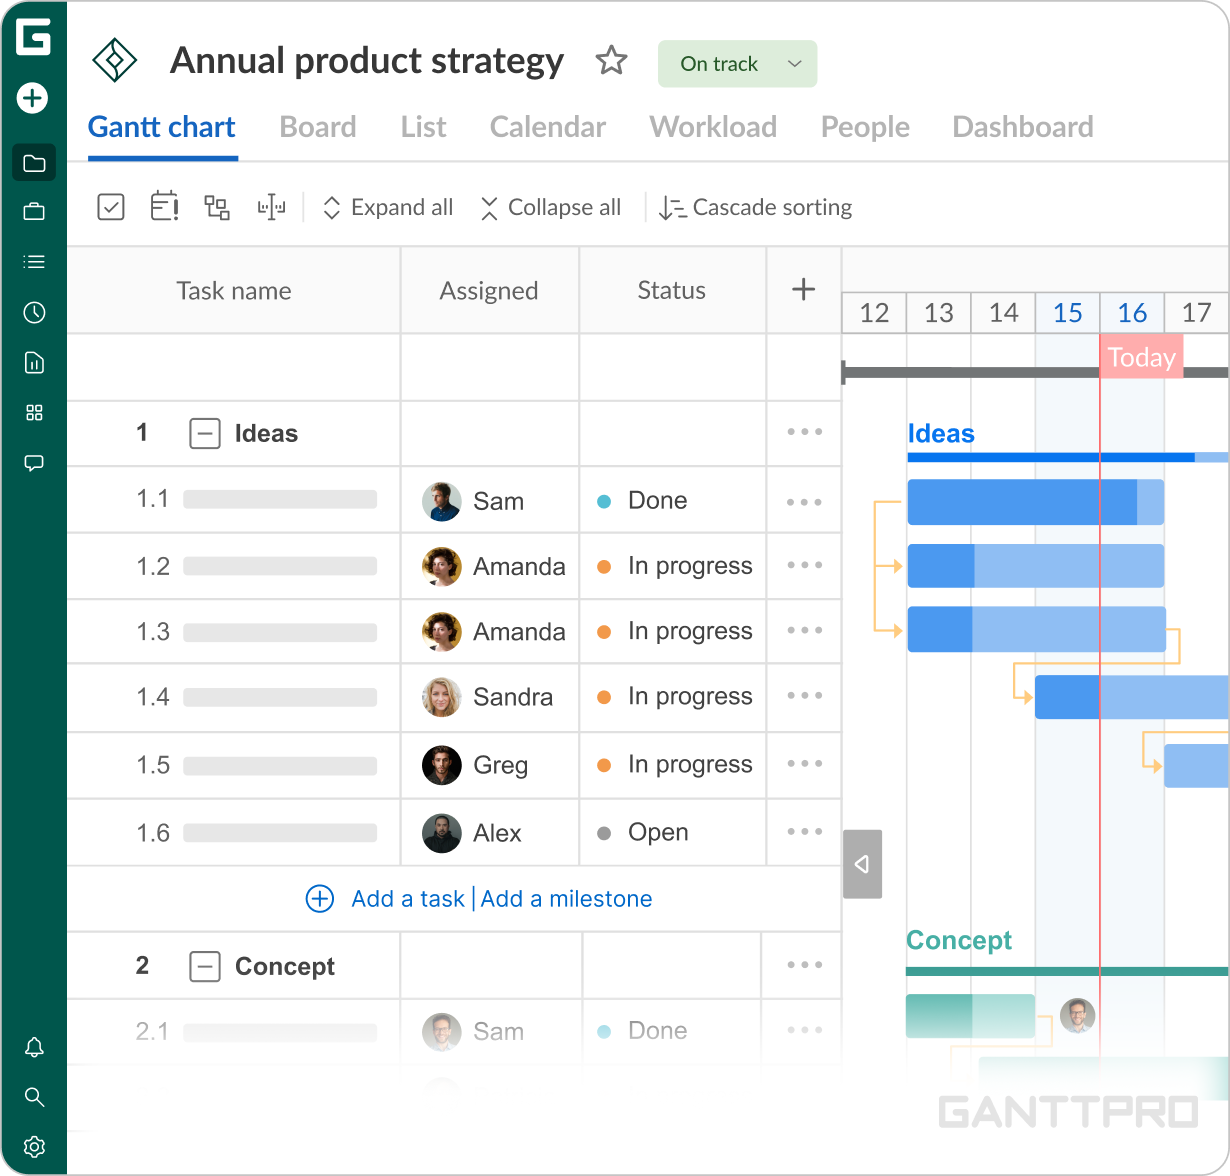
The diagram gives us the clearest view of the entire workflow. We can adjust durations and scale, see the connections between stages, and view everything at a glance on a large screen.
Struggle
How did your approach look before GanttPRO?
As the scope of work grew, so did the risks of overloading individual specialists and making errors in task allocation. Manual control became impossible. A timeline view was the natural choice for the company’s field, but the team still needed to choose the right product, the one that would visualize all the elements and help distribute tasks correctly among specialists.
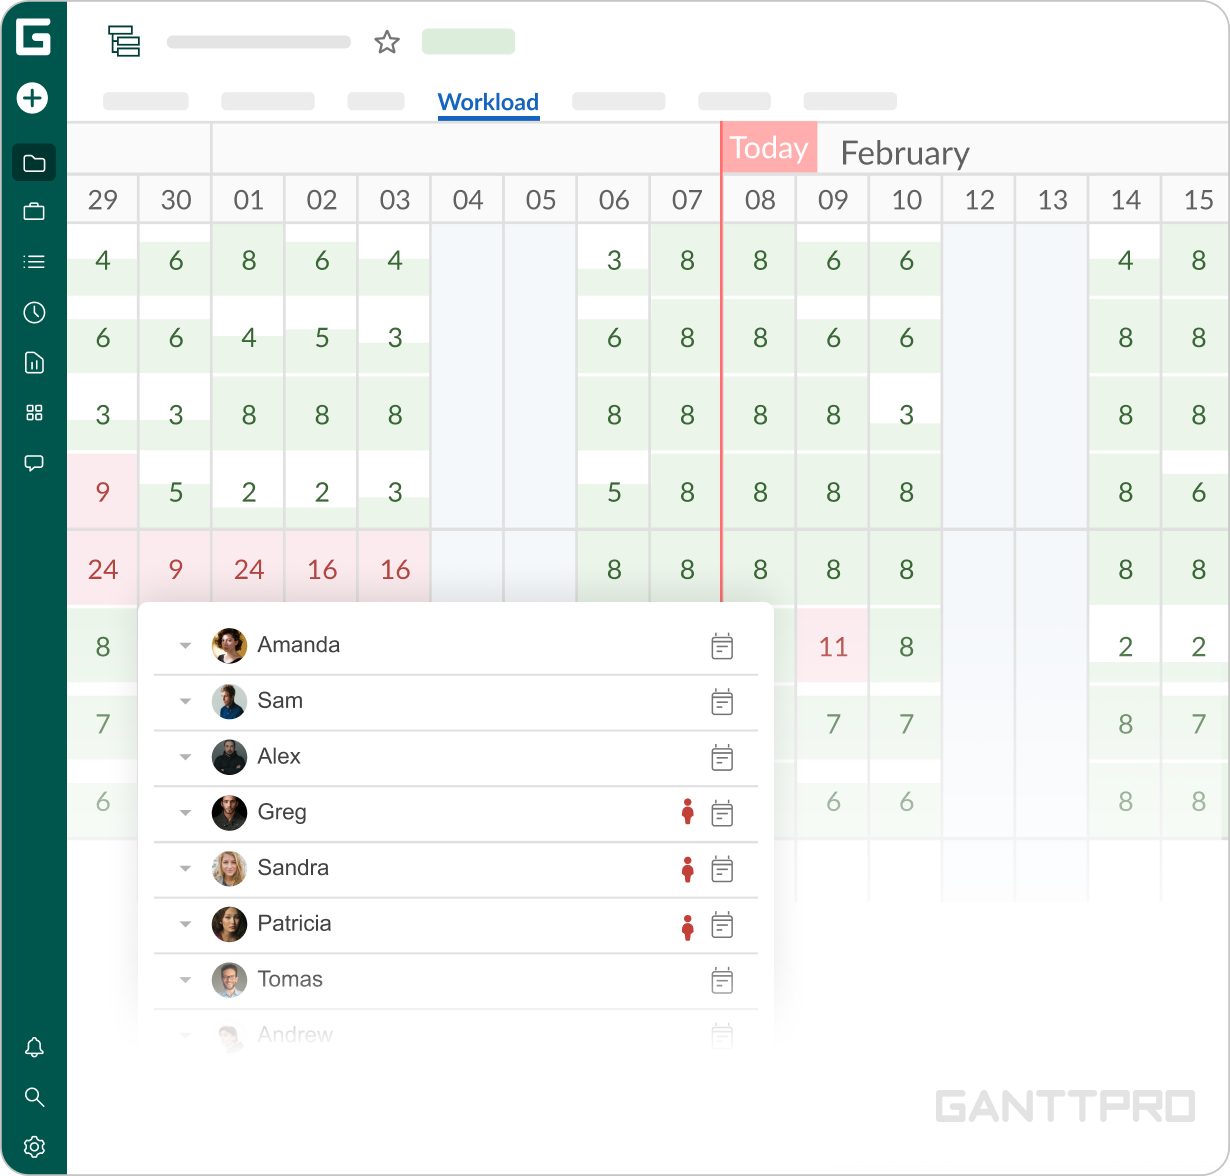
Resource management was an especially important requirement: “When it’s hard to keep track of every detail manually, it becomes very easy to overlook a single specialist’s workload. Consequently, one person may end up being involved in several projects at once, which leads to overload, disrupted deadlines, and a slowdown of the entire process.”
From Clickup to Monday, the team was testing different products but none of them combined simplicity with the functionality for effective risk management and resource allocation.
“Your Gantt chart is incredibly visual. And the resource workload tool is simply outstanding.”
Solution
After testing a large number of products in 2020, GanttPRO offered the most visual Gantt chart with one of the strongest workload modules on the market.
“When a project lasts a year, and after six months you realize that you simply don’t have enough engineers for a specific section, this helps you save deadlines. Without such a tool, it would be impossible to predict overload and open a new vacancy in advance.”“The diagram gives us the clearest view: we can now adjust durations and scale, see the connections between stages, and everything at once on a large screen.”
Impact
What does your work look like now with GanttPRO?
Today, GanttPRO serves as a strategic tool for the company’s management team. Risk assessment, planning, and status control across all projects have become clearer and more predictable. Weekly status review helps respond to changes faster and make hiring decisions when needed.
Reviewing 10 projects a day is already difficult. When there are 50, you need a dedicated specialist. Ideally, one person should manage the Gantt chart daily, update statuses, assign tasks, and track risks. We are now moving toward appointing such an employee.